| VTS Language |
| |
| The basic elements of our graphical notation are points connected
by lines and arrows. Points are labelled by the corresponding
(possibly empty) set of events, meaning that the point stands for
the occurrence of one of these events during execution. An arrow
between two points indicates precedence of the source point with
respect to the destination point. A set of events labelling the
arrow are interpreted as forbidden events between both points. |
| A simple introduction to this notation can be found in the
following examples. Fig. 1 shows a VTS pattern
that expresses a predicate about an execution that is true if and
only if it contains a stimulus e followed by two responses r1
and r2 (i.e., the next r1- and r2-events), which are not
separated by another response, r3. Triangles bellow points are
used to assign them an optional name. |
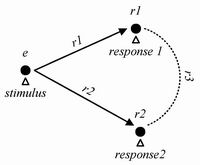
Figure 1. Separated responses |
| The arrows from stimulus to response1 and response2 indicate
that stimulus e occurs before responses r1 and r2,
regardless of the relative order between them. To indicate that
the point response1 (respectively response2) is the first
occurrence of its label after e (i.e. there is not another r1
(r2) between e and r1 (r2)), we label with r1 (r2) the
arrow stimulus-response1 (-response2). In order to express
the condition "... which are not separated by another response,
r3", we add a dashed line linking response1 and response2,
labelled with r3. We use a line instead of an arrow because
there is no precedence between response1 and response2 (their
relative order is unimportant). Now we can illustrate when a given
execution matches the VTS scenario of
Fig. 1. Suppose that we have the following sequences
of events: |
| s1: | ... a, e, b, c, r1, d, r3, r2, z..., |
| s2: | ... a, e, b, c, r1, d, r2, f, r3, z..., |
| s3: | ... a, e, b, r2, r1, c, r3, r2, z.... |
|
|
Then sequences s2 and s3 match the scenario, because the first
r1-event and r2-event after the only e-event have no
r3-event in between. If this should be interpreted as a
negative scenario, we would discard systems producing s2
and s3 for violating our requirement. On the contrary, the
sequence s1 does not match the scenario, and therefore would
satisfy (agree with) the requirement. |
| The trained reader should immediately appreciate the simplicity of
this notation over non-graphical alternatives. For example the
following TCTL [ACD93]
formula(*) expresses the same requirement as the
scenario in Fig. 1.
|

|
|
VTS has the virtue, over this kind of notations, of being
intuitive enough to be used by industry practitioners lacking
academical training, while still possessing a formal semantics and
serving as an input for formal verification methods such as
modelchecking. |
| (*) We are using a trick
to predicate on states instead of events as is used in the Kronos
tool [BDM+98]. Another possible technique are
fluents [GM03]. |
| Let us introduce now a simple case including temporal constraints.
The scenario of Fig. 2 captures the case
where a stimulus e is not followed by any response within 100
time units (a violation of a bounded response property). The
unlabelled point represents an instant after the stimulus e
occurs. The restriction >100 under the arrow means that the
temporal distance between both is greater than 100 t.u. We express
the absence of events r1 and r2 between stimulus and
instant by labelling the arrow with r1, r2. |
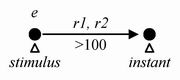
Figure 2. Bounded response |
| When scenarios include temporal restrictions, they must be matched
to time-stamped sequences. Let us consider the previous sequences,
with timestamps added to each event (for the sake of simplicity,
we use natural numbers as timestamps, but VTS admits any
non-negative real numbers): |
| s4: ... |
a |
e |
b |
c |
r1 |
d |
r3 |
r2 |
z |
..., |
| 12 |
15 |
39 |
50 |
72 |
123 |
140 |
148 |
155 |
| s5: ... |
a |
e |
b |
c |
r1 |
d |
r2 |
f |
r3 |
z |
..., |
| 3 |
7 |
12 |
88 |
109 |
111 |
114 |
121 |
125 |
152 |
| s6: ... |
a |
e |
b |
r2 |
r1 |
c |
r3 |
r2 |
z |
..., |
| 5 |
7 |
69 |
78 |
87 |
100 |
146 |
152 |
199 |
|
| Sequence s5 matches the anti-scenario of
Fig. 2, because neither an r1-event nor a
r2-event appears after e for 100 t.u., thus violating the
bounded response requirement. On the other hand, sequences s4
and s6 do not match the (negative) scenario, so they satisfy the
requirement. |
| We now have the elements to describe a more complex requirement: a
correlated response. Fig. 3 shows a
VTS pattern for the violation of the requirement that
whenever two responses follow a given stimulus e
(i.e., the next r1, r2 labelled events) they should be separated by at least 20 t.u. and at most 100 t.u.
As in Fig. 1, the arrows indicate the relative
ordering between e, r1 and r2. In this example we introduce
an abbreviation to represent a frequent sub-pattern: there is no
other r1-event between e and a particular r1-event (i.e.
certain point represents the next occurrence of r1 after
e). The abbreviation is a second (open) arrow near r1, and is
equivalent to adding r1 as a forbidden event on the arrow (as we
did in Fig. 1). The temporal constraint is expressed
as ¬[20,100] on the dashed line between the responses.
Conversely, in order to express that there is not another
e-event after a particular e and before an r1-event (i.e. to
signal the previous e-event before r1) a symmetrical
notation can be used: an open arrow near the e extreme. |
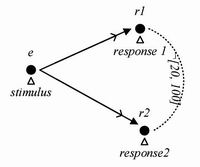
Figure 3. Correlated responses |
| Returning to sequences s4, s5 and s6, it can be seen that
s4 does not match the scenario in
Fig. 3, because the temporal distance
between the r1 and the r2-events (148 - 72 = 76 t.u.) is not
in the time span ¬[20,100]. The opposite happens for s5
with inter-responses distance equal to 114 - 109 = 6 t.u. and
s6, with 87 - 78 = 9 t.u. |
| Another useful idiom asserts that something happens (or not) since
the beginning or until the end of a given execution. For these
situations, VTS has two special symbols: a big full circle
for begin, and two concentric circles for end. For
example, we show in Fig. 4 a scenario stating that
the temporal distance between the first a and the last b (both
in the whole execution) is limited to 100 t.u. |
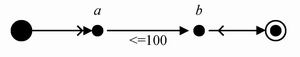
Figure 4. Begin and end symbols |
| VTS can also identify the
first or the last in a
(possibly unordered) set of events. In the graphical notation, the
first event in a set is represented by a point linked to each
point in the set by dotted lines ending in small empty circles. A
similar notation is used for the last event, but using a small
full circle. Nested combination of first and last representatives
are allowed, as can be seen in Fig. 5. Part of this
scenario will match situations where, given two set of events,
{a1,a2} and {b1,b2,b3}, the temporal distance between the
last event in each set to occur is less than 100 t.u.
Fig. 5 also shows how VTS can convey very
complex properties of a system. This scenario depicts the case
where a watchdog is turned on (wd-on) at least 50 t.u. before
any event in both sets occurs and not turned off until all
monitored events occur. This watchdog is supposed to detect the
case described above (certain time spread between the first and
the last group to end). As this is a negative scenario, it matches
(faulty) traces in which all these conditions are met and yet the
watchdog fails to issue such an alarm. |
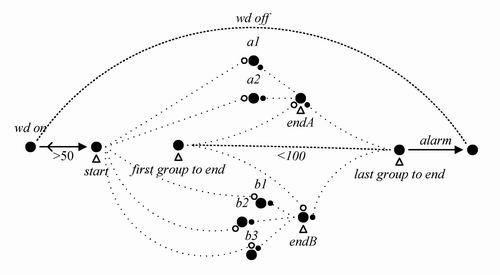
Figure 5. Representatives |
| The next table summarizes the complete graphical
notation of VTS. |
| |
|
|